Summary:
China’s manufacturing shift to Southeast Asia is not driven by any single factor; it is the cumulative effect of four forces — tariffs and geopolitics, structurally rising production costs, trade-agreement access, and the need for supply-chain resilience. The latest data confirm the momentum: Cambodia attracted US$5.2 billion in FDI in 2025, up 18.2% year-on-year, with Chinese capital accounting for roughly US$3.76 billion (over 70%) and manufacturing investment growing by about 50%.
This article unpacks the four drivers using 2025–2026 figures, maps the division of roles between Cambodia, Vietnam and Thailand, and explains why “relocating to Southeast Asia automatically avoids US tariffs” is a common misconception — the real differentiator lies in EU EBA access and RCEP rules-of-origin cumulation, not US tariff arbitrage. The article closes with a practical five-step evaluation sequence to move from trend awareness to a concrete sourcing or site-selection decision.
why “Southeast Asia” has become the anchor of the conversation
Over the past several years, “should we move production to Southeast Asia?” has moved from a strategic option discussed at a handful of large manufacturers into a question that many companies revisit every year. Repeated tariff renegotiations, customer requirements for diversified country-of-origin, and steadily rising labour and land costs are pressures that will not disappear by waiting them out.
Whether you are evaluating a new manufacturing footprint in the region, or trying to understand how this structural shift will reshape your own supply chain and competitive position, the starting point is the same: getting clear on why now, and why Southeast Asia. This article first sizes the shift with data, then unpacks the four drivers one at a time, and closes with a practical sequence for moving from trend awareness to action.
The scale of this shift: what the data show
Start with the most current numbers. According to the National Bank of Cambodia (NBC) and the Council for the Development of Cambodia (CDC), Cambodia attracted US$5.2 billion in FDI in 2025, up 18.2% year-on-year. China was by far the largest source at roughly US$3.76 billion (over 70% of the total), up about 42% from 2024. Manufacturing was the most prominent segment, with related investment growing about 50%, concentrated in export-oriented sectors such as garments, footwear, electronics assembly and machinery components.
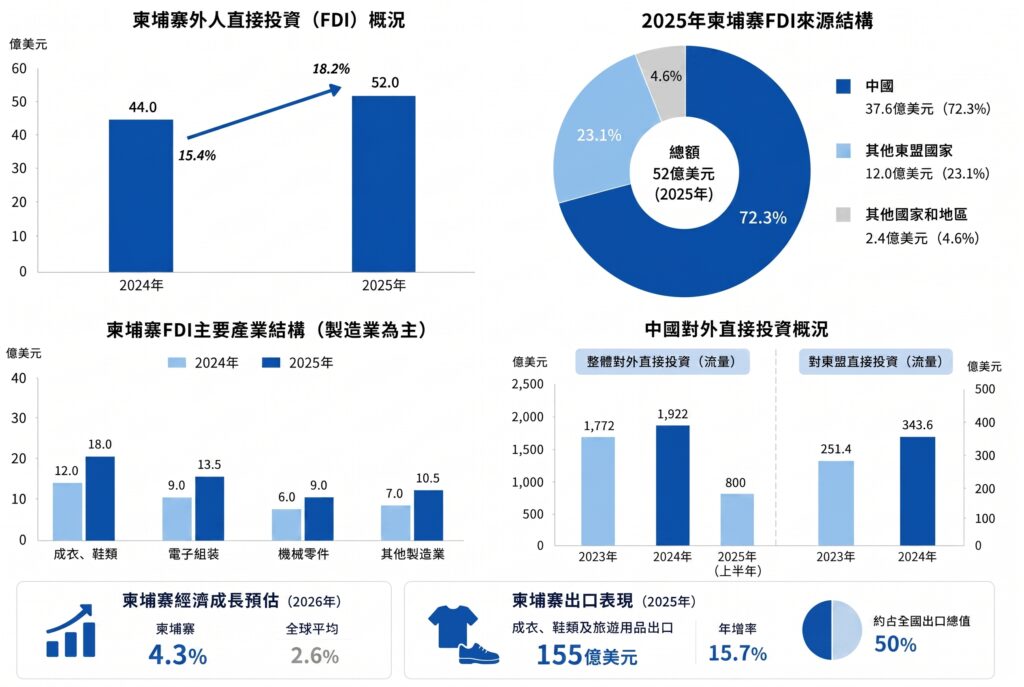
The view from the China outbound side points in the same direction. China’s 2024 Statistical Bulletin of Outward FDI shows total outbound investment of US$192.2 billion (+8.4%), of which US$34.36 billion went to ASEAN — a 36.8% year-on-year increase, far exceeding the overall growth rate. China’s total outbound investment moderated in 2025 under external pressure (EY put H1 2025 at roughly US$80 billion, –6.2%), but manufacturing, technology and clean-energy supply chains remained leading destinations — meaning the specific theme of manufacturing relocation into Southeast Asia has been more resilient than the overall outbound flow.
On the receiving side, ASEAN’s growth continues to provide support. The World Bank projects Cambodia’s 2026 GDP growth at around 4.3%, well above the global average of about 2.6%. The export mix is also strengthening: Cambodia’s garment, footwear and travel-goods exports reached US$15.5 billion in 2025, up 15.7%, accounting for roughly half of total exports. A region that is still growing and sits next to the Chinese supply-chain base naturally becomes the leading destination for relocated capacity.
Driver 1: tariffs and geopolitics, and why they are forcing a redesign of country footprints
Tariffs and geopolitics are the most direct push factor. When export costs into the main end-markets rise on tariff grounds and the policy risk of a single country of production rises with them, companies are pushed to add a “non-China” production node.
The 2025 tariff backdrop matters. The US reciprocal tariff on Cambodia, after initial threats of 49% and then 36%, was set at 19% under the US–Cambodia Agreement on Reciprocal Trade signed in October 2025. Those reciprocal tariffs were struck down by the US Supreme Court on February 20, 2026; since July 24, 2026, Cambodian goods have instead paid a 10% country tariff under Section 301 measures, against 12.5% for Vietnam, Thailand and China and 10% for Indonesia, Malaysia and Bangladesh.
▼ A common misconception
US tariff rates across Southeast Asia cluster in a narrow band (10%–12.5% since July 24, 2026), so “moving to Southeast Asia automatically avoids US tariffs” does not hold up. The real value of relocation is more about diversifying the policy risk of single-country production, and about using Southeast Asia’s trade-agreement access to the EU and RCEP markets (see Section 5), than about US tariff arbitrage as such. Setting the motivation correctly upfront helps avoid the wrong bets later in site selection.
Driver 2: structural rise in production costs
Total production cost in many of China’s labour-intensive segments has risen consistently over the past decade. For sectors such as garments, footwear and bags, hardware, and home and building materials — where labour and land dominate the cost base — Southeast Asia continues to offer a relative advantage on wages, land and certain energy prices.
The word “structural” matters. This is not short-term volatility; it reflects long-run forces — demographics, land prices, environmental compliance — acting in the same direction. In Cambodia, for instance, the 2026 statutory minimum wage in the garment, footwear and travel-goods (GFT) sector is US$210 per month for regular workers (US$208 for probationary workers), per the Ministry of Labour and Vocational Training’s Prakas 214/25, effective 1 January 2026 — a modest US$2 increase from 2025.
For labour-intensive sectors, where wage and land make up the bulk of the cost base, Southeast Asia’s relative advantage is clearer. For capital- and technology-intensive sectors, supply-chain depth and skilled-labour availability tend to matter more than unit labour cost, and a low headline wage may not translate into a lower total cost.
▼ Decision tip
do not look only at “how much cheaper unit labour is” — calculate landed cost, including logistics, productivity loss, management overhead and compliance cost. For a granular cost breakdown, see our companion articles “Cambodia Manufacturing Labour Cost & Workforce Supply Analysis” and “Cambodia Manufacturing Setup Guide”.
(Note: line-item country comparisons of labour and utility costs should be re-verified against the latest first-hand quotations before being used in production decisions.)
Driver 3: trade-agreement access — Southeast Asia’s underestimated edge
Compared with US tariffs, Southeast Asia’s export channels under RCEP and EU preference schemes are often the more material — and most underestimated — advantage, especially for export-oriented manufacturers.
Cambodia is a useful illustration. Two mechanisms stand out. As an RCEP member, Cambodia can leverage regional cumulation rules of origin to strengthen its competitive position in Asia-Pacific export markets. The EU’s Everything But Arms (EBA) scheme — duty-free, quota-free access for all goods except arms — has long been one of Cambodia’s most important market-access mechanisms.
One nuance is essential: EBA preferences have been partially withdrawn since August 2020 (over human-rights concerns), so the scheme is not fully duty-free. That status persists in 2026. However, according to EU data, roughly 75% of Cambodia’s exports still enter the EU duty- and quota-free under EBA, and garments account for close to 80% of preferential imports. For garment and footwear manufacturers focused on the EU market, the “trade-channel value” of a Southeast Asian production base can outweigh US-tariff considerations.
Cambodia’s FTA network is also relatively diverse. As of 2025, Cambodia is party to 11 free-trade agreements, including RCEP, the Cambodia–China FTA, the Cambodia–Korea FTA and EU EBA. This network supports “Chinese inputs + Cambodian processing” designs that use cumulation to qualify for preferential tariffs in target markets.
| Export market | Key mechanism | What it means for site selection |
| United States | Country tariff (from July 24, 2026: Cambodia 10%, Vietnam 12.5% — narrow gap) | Value is in diversifying policy risk, not tariff arbitrage |
| European Union | EBA (partially withdrawn; most products still duty-free) | Material advantage for garments, footwear and similar beneficiary sectors |
| Asia-Pacific (RCEP) | RCEP rules-of-origin cumulation | Strengthens regional supply chains and export competitiveness |
Driver 4: supply-chain resilience and “China Plus One”
A growing share of international buyers now requires their suppliers to operate at least one non-China production site, turning “China Plus One” from a hedging option into a near-prerequisite for winning orders. This converts what was once a one-off de-risking move into a long-term structural redesign of supply chains.
The core of “China Plus One” is not “leaving China” — it is keeping the China base while building a second or even third production node, in order to manage tariffs, geopolitics, natural disasters and single-market volatility. For many manufacturers, the push to build a Southeast Asian site increasingly comes from downstream brand owners and procurement teams as an explicit requirement, rather than from the manufacturer’s own risk planning. This “demand-side” character is what makes it a structural multi-year trend rather than a passing wave.
A new dynamic worth watching in 2025–2026 is “Vietnam Plus One”. As the US tightens transshipment and rules-of-origin scrutiny on Vietnamese exports and as Vietnam’s wages and land costs continue to rise, companies already established in Vietnam are evaluating a nearby second backup site. For Cambodia, the profile of incoming companies in this wave is materially stronger than in the early 2010s — most already have export experience and supply-chain management capability, which has structural implications for the upgrading of Cambodia’s industrial base.
Why Southeast Asia? How Cambodia, Vietnam and Thailand divide the work
Southeast Asia’s appeal rests on four layered advantages: proximity to the Chinese supply chain, relatively low cost, trade-agreement access, and continued domestic-market growth. Within the region, different countries take on distinctly different roles.
| Country | Core strengths | Typical sectors | Key considerations |
| Vietnam | Scale, mature electronics supply chain | Electronics assembly, downstream textiles | Costs and land prices rising; transshipment scrutiny tightening |
| Thailand | Complete industrial base, mature supply chains | Automotive, electronics, electrical appliances | Better suited to capital-intensive sectors; higher labour costs |
| Cambodia | Competitive labour cost, EBA/RCEP access, proximity to Vietnam supply chain | Garments, footwear/bags, machinery, appliances | Upstream supplier clusters still being built |
Cambodia’s eastern provinces sit immediately next to the Vietnam border and the Ho Chi Minh City supply-chain belt — a useful proposition for companies that want to draw on Vietnam’s mature ecosystem while keeping costs in check. The right question for any evaluating company is not “which country is best” but “which country best fits my sector, primary export markets and cost structure.”
Turning China’s manufacturing shift awareness into evaluation action
Start by clarifying the motivation for relocation — risk diversification, cost reduction, or market-access — then use that motivation to screen countries and parks; finally, run due diligence across landed cost, compliance and logistics so as not to be misled by any single headline advantage. A practical evaluation sequence is:
- Define your primary export markets and the structural characteristics of your sector; map them to the relevant trade agreements and candidate countries.
- Compare landed cost across the shortlist, rather than headline labour cost alone.
- Assess supply-chain proximity and logistics paths (where raw materials originate, and where finished goods need to ship).
- Verify compliance and risk — labour law, environmental impact assessment (EIA), and political and policy stability.
- Conduct on-site visits to industrial parks to confirm infrastructure and one-stop service capability.
Conclusion: the value of a mature SEZ lies in having lived through cycles
Having reviewed the trend and the four drivers, the next step for most manufacturers is not to keep comparing “which country is cheapest,” but to assess “which industrial park can let me reach commercial volumes on a second production line within twelve months.” Country-level figures (wages, tax rates, FTA coverage) are entry conditions; what really determines the success of a new establishment is park-level conditions — infrastructure stability, administrative efficiency, supplier clustering on-site, safety and security, and living amenities for staff.
Manhattan Special Economic Zone (MSEZ) is located at Bavet on Cambodia’s border with Vietnam — about 70 kilometres from Ho Chi Minh City Port and about 160 kilometres from Phnom Penh — making it one of the very few Cambodian parks that combines a “Vietnam Plus One” geographic advantage with a mature operating track record. Established in 2005 and now operating for more than 20 years, the zone covers around 600 hectares and currently hosts over 40,000 workers. On-site supplier clusters in textiles, footwear, bags and electronics assembly are already developed, which means new entrants do not need to build a local network from zero.
If you are currently evaluating a Southeast Asian production base, the most useful first step is to clarify your own export-market profile and sector characteristics before moving to detailed site selection. To discuss land and factory options in Cambodia or to arrange an initial fit assessment for your operation, please contact the MSEZ team.
FAQ
Q1. Is China’s manufacturing relocation to Southeast Asia primarily a way to avoid US tariffs?
| Partly, but not primarily. Since July 24, 2026, the US has applied a 10% country tariff to Cambodia, against 12.5% for Vietnam and Thailand and 10% for Indonesia, Malaysia and Bangladesh — so the cross-country differences are small, and pure tariff avoidance has limited value. The more material drivers are diversification away from single-country policy risk, the use of Southeast Asia’s EU EBA and RCEP export channels, and meeting international buyers’ explicit requirement for a non-China backup site. |
Q2. Which sectors are best suited to relocating to Southeast Asia?
| Labour-intensive sectors whose cost base is dominated by wages and land — textiles and apparel, footwear and bags, hardware, home and building materials, packaging materials — tend to benefit most. Capital- and technology-intensive sectors need a more careful assessment of supply-chain depth and skilled-labour availability before relocating. |
Q3. Does relocating to Southeast Asia automatically reduce cost?
| Not automatically. Labour and land are usually cheaper, but the proper basis for comparison is landed cost — including logistics, productivity loss, management overhead and compliance. Looking only at unit labour rates tends to understate the true cost. |
Q4. Between Cambodia, Vietnam and Thailand, how should I choose?
| It depends on sector characteristics and primary export markets. Vietnam has the most mature supply chain at scale; Thailand suits full-supply-chain and capital-intensive production; Cambodia is best positioned for labour-intensive sectors and EU-market access via EBA. The decision should be made by matching your own profile against country attributes, not by reading a single ranking. |
Q5. Is now still a good time to relocate?
| “China Plus One” has shifted from a short-term hedge to a structural redesign of supply chains, and is increasingly driven by downstream buyer requirements — so the question is less about timing the window and more about evaluating the move thoroughly when it is undertaken. |
References
- National Bank of Cambodia (NBC) / Council for the Development of Cambodia (CDC) | 2025 FDI inflow US$5.2B (+18.2%); Chinese capital ~US$3.76B (over 70%); manufacturing investment growth ~50% (reported via Khmer Times and Cambodia Investment Review, Feb 2026)
https://www.khmertimeskh.com/ - Cambodia Ministry of Commerce (MoC) | 2025 garment, footwear and travel-goods exports US$15.5B (+15.7%) (Jan 2026)
Cambodia makes 15.5 bln USD from exports of garments, shoes, travel goods in 2025 - Cambodia Ministry of Labour and Vocational Training (MLVT) | Prakas 214/25: 2026 GFT minimum wage US$210/month for regular workers, US$208 for probationary workers, effective 1 Jan 2026 (DFDL, ASEAN Briefing, Khmer Times reports, Sep 2025)
https://www.fibre2fashion.com/news/textile-news/cambodia-raises-2026-monthly-minimum-wage-to-210-from-208-now-305451-newsdetails.htm - Office of the United States Trade Representative (USTR) | Fact Sheet: U.S.–Cambodia Agreement on Reciprocal Trade, 19% reciprocal tariff (Oct 2025); struck down by the US Supreme Court on Feb 20, 2026 and replaced by a 10% Section 301 tariff from Jul 24, 2026 (US Federal Register, Jul 28, 2026)
https://bowergroupasia.com/cambodia-tariff-tracker-august-1-2025/ - BowerGroupAsia | Cambodia Tariff Tracker: Cambodia 19%, Vietnam 20%, Indonesia 19% comparison (2025)
https://policy.trade.ec.europa.eu/eu-trade-relationships-country-and-region/countries-and-regions/cambodia_en - Ministry of Commerce of the People’s Republic of China | 2024 Statistical Bulletin of Outward FDI: total outbound flow US$192.2B; to ASEAN US$34.36B (+36.8%) (2025)
http://big5.www.gov.cn/gate/big5/www.gov.cn/lianbo/bumen/202509/content_7039563.htm - EY China Overseas Investment Practice | China Overseas Investment Overview, H1 2025 (Aug 2025)
https://www.ey.com/zh_cn/insights/china-overseas-investment-network/overview-of-china-outbound-investment-of-h1-2025 - World Bank | Cambodia 2026 GDP growth outlook ~4.3% (2026)
Cambodia’s economy will slow down to 4.3% in 2026 before rebounding to 5.1% in 2027, World Bank says